Monitoring and Search Analytics
How Semanteer search monitoring works
Semanteer keeps track of all search events that it’s aware of - in essence all requests made, whether they are “normal” search requests, “navigation” requests, or requests to retrieve individual records. In fact, Semanteer’s search layer API generates two types of action URLs, a “simple” type, intended to be shown to the user and used in the browser history stack, and a second type that has additional behavior tracking parameters included. Events are tracked whichever of the two types of URLs are used to make a request to the search layer, but as one might expect, the additional tracking parameters, when present, enable richer statistics to be derived.
Something that requires separate mention is how the monitoring of “clicks” (i.e., the selection of search results in the frontend) is tracked. There are two possibilities in this case:
-
Use the corresponding action URLs generated by the search layer, which either retrieve the corresponding individual record, or redirect to the URL of the web resource that the record “points to”. (which of the two types gets generated can be configured as necessary)
-
Use the so called “log” URLs also generated by the search layer - these allow the frontend to notify Semanteer that a result was clicked, even if the click is handled directly by the frontend and no record is retrieved from Semanteer (e.g., in a shop system, the product with the selected identifier is directly shown). See also Monitoring URLs.
The Semanteer monitoring dashboard
Once the monitored search events have been communicated to Semanteer, they are stored in a special dedicated index, and can be used to derive statistics and indicators - both standardized ones, and custom ones of interest to the client. These statistics and indicators can be defined and accessed in a “human-readable” form in Semanteer’s monitoring dashboard.
| Try it out: Let’s have a look at the dashboard of our demo search: http://search-features.demos.contexity.ch/monitoring |
Below you can see a screenshot of the dashboard’s default configuration, followed by an explanation of the pre-configured panels containing statistics and indicators, as well as controls that enable end users to interact with the presented statistics.
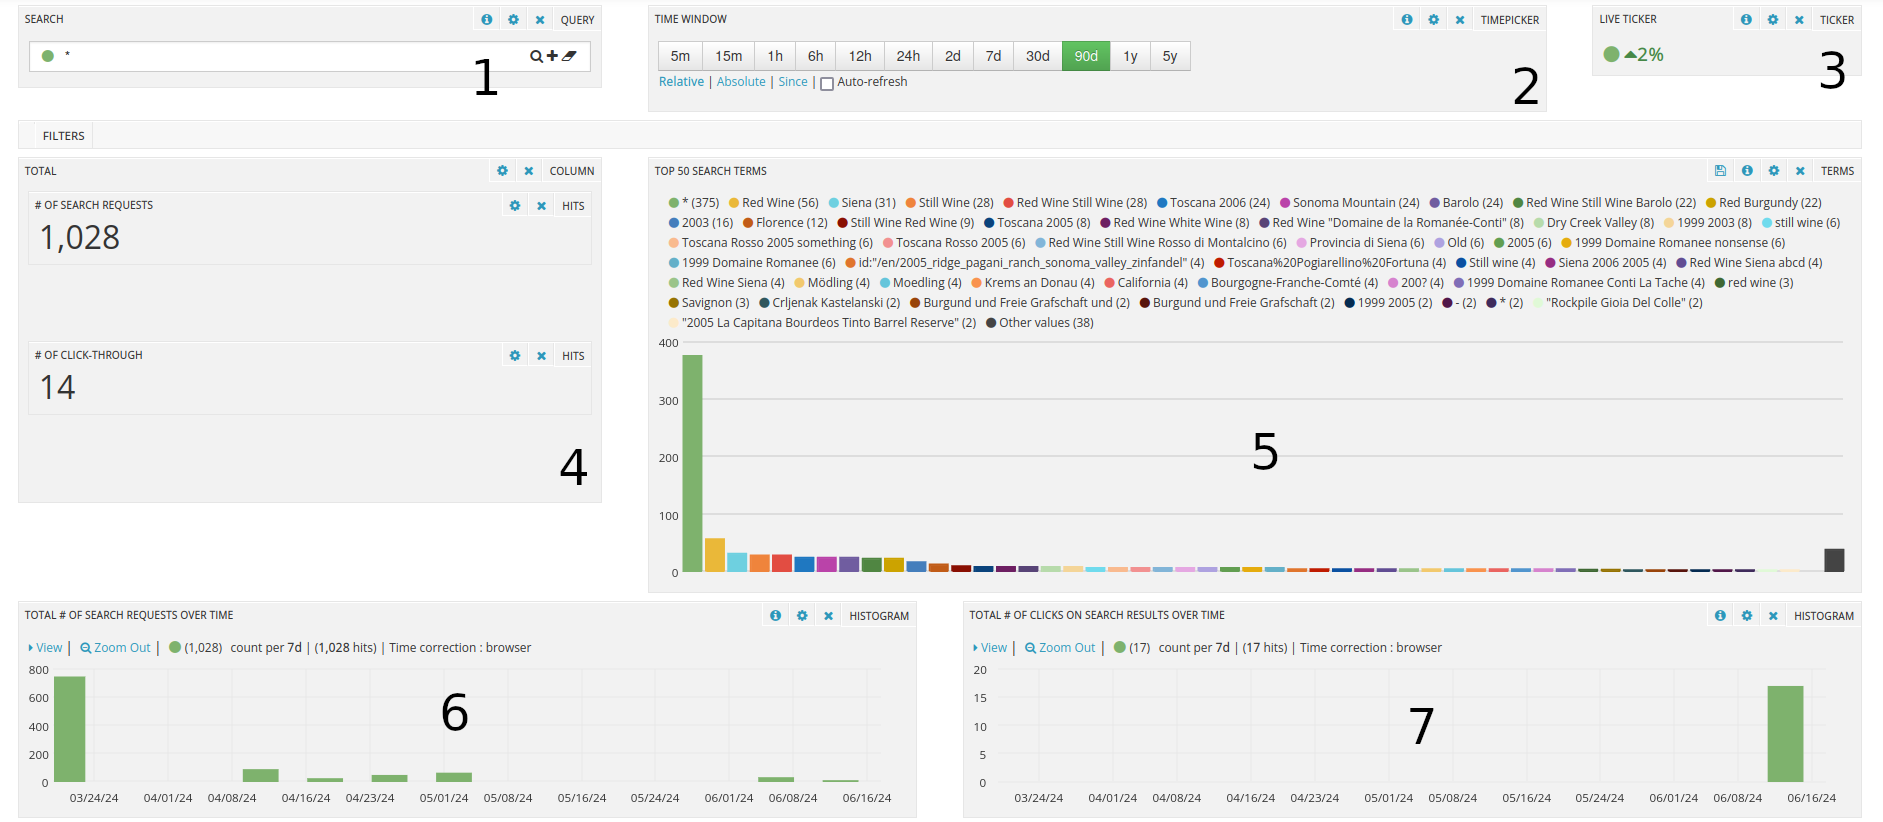
The numbered panels in the above figure are as follows:
-
The “Search” panel (Panel #1) allows users to refine the (types) of events that they want to see statistics for. We will return to the this panel soon and show some typical filtering cases.
-
The “Time window” panel (Panel #2) allows users to select the period for which they want to see stats. Selections in this panel like in the “Search” panel as well, affect what is shown everywhere else in the dashboard.
-
The “Live ticker” (Panel #3) shows how the total count of (potentially filtered) events trends, percentage wise, between the current and immediately preceding time window.
-
The next panel (Panel #4) shows:
-
The total number of search requests received by Semanteer in the selected time window
-
The total number of “click through” events in the same period. A “click through” is a click on a prefetched result shown in the autocomplete dialog, and is different than a click on a result in the SERP.
-
-
The “Top search terms” panel (Panel #5) shows the most common terms in the received search requests. These may include “asterisk” searches (typical in navigation calls), and searches for specific articles or products by their identifier (denoted by query strings with a format similar to “id:…”)
-
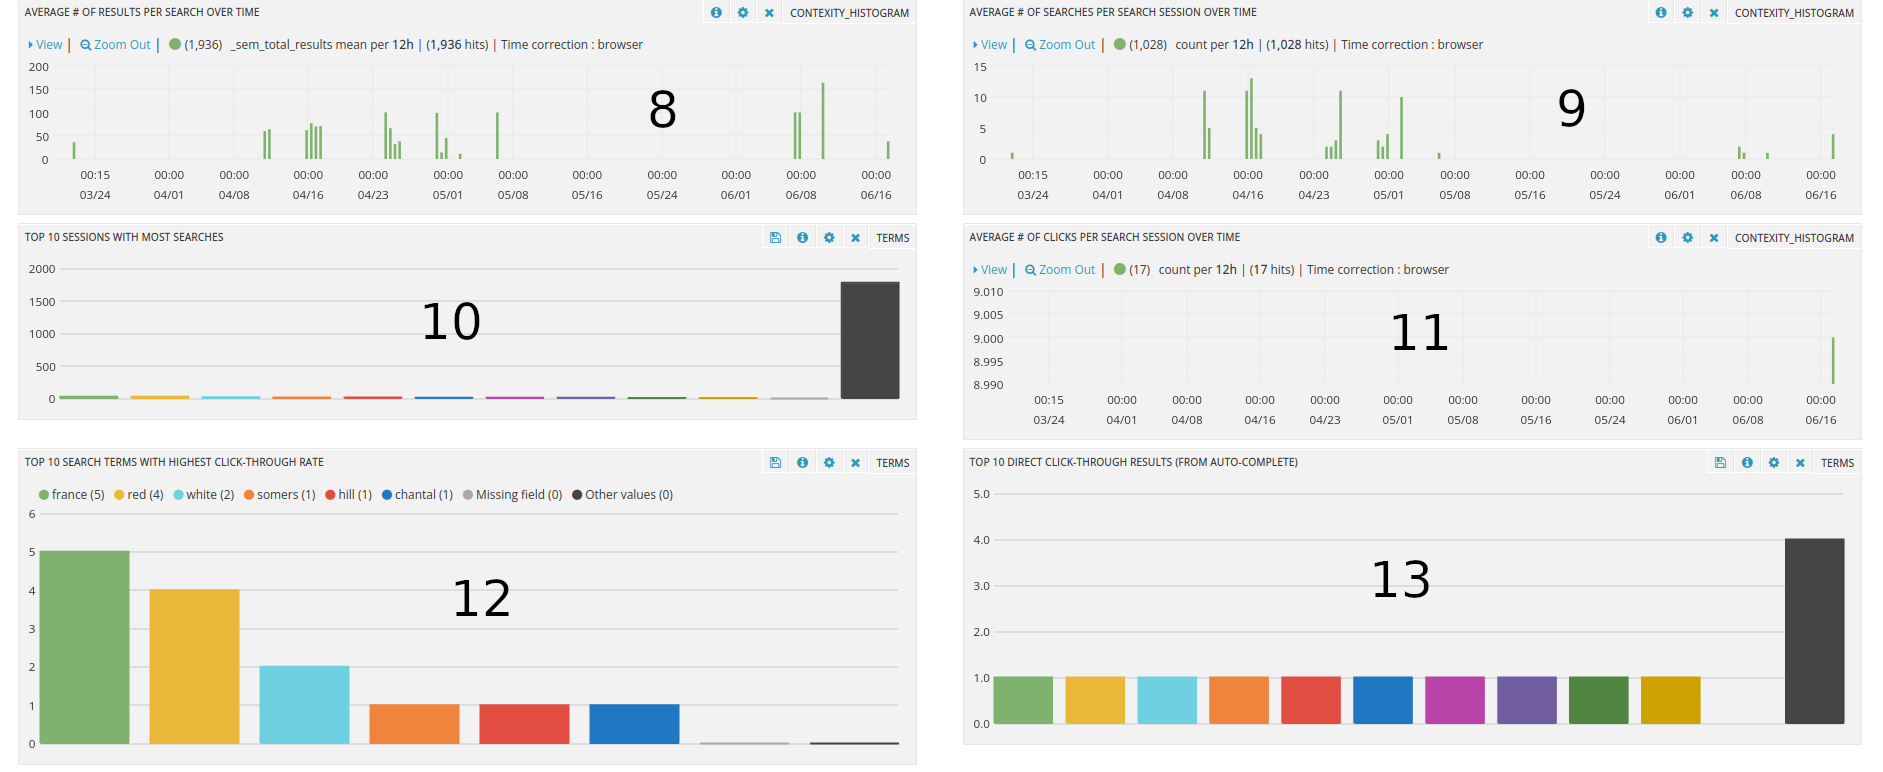
Panels #6 to #9 shows averages over subdivisions of the currently selected time window for:
-
Total number of search requests
-
Total number of clicks on search results
-
Number of results per search
-
Number of searches within distinct search sessions
-
-
Panel #10 shows the top sessions with the most searches in the selected time window.
-
Panel #11 shows the average number of result clicks per search session
-
Panel #12 shows the search terms with the highest click-through rates (clicks on results shown directly in the autocomplete dialog)
-
Panel #13 shows the prefetched results with the highest click-through rates (clicks on results shown directly in the autocomplete dialog)
-
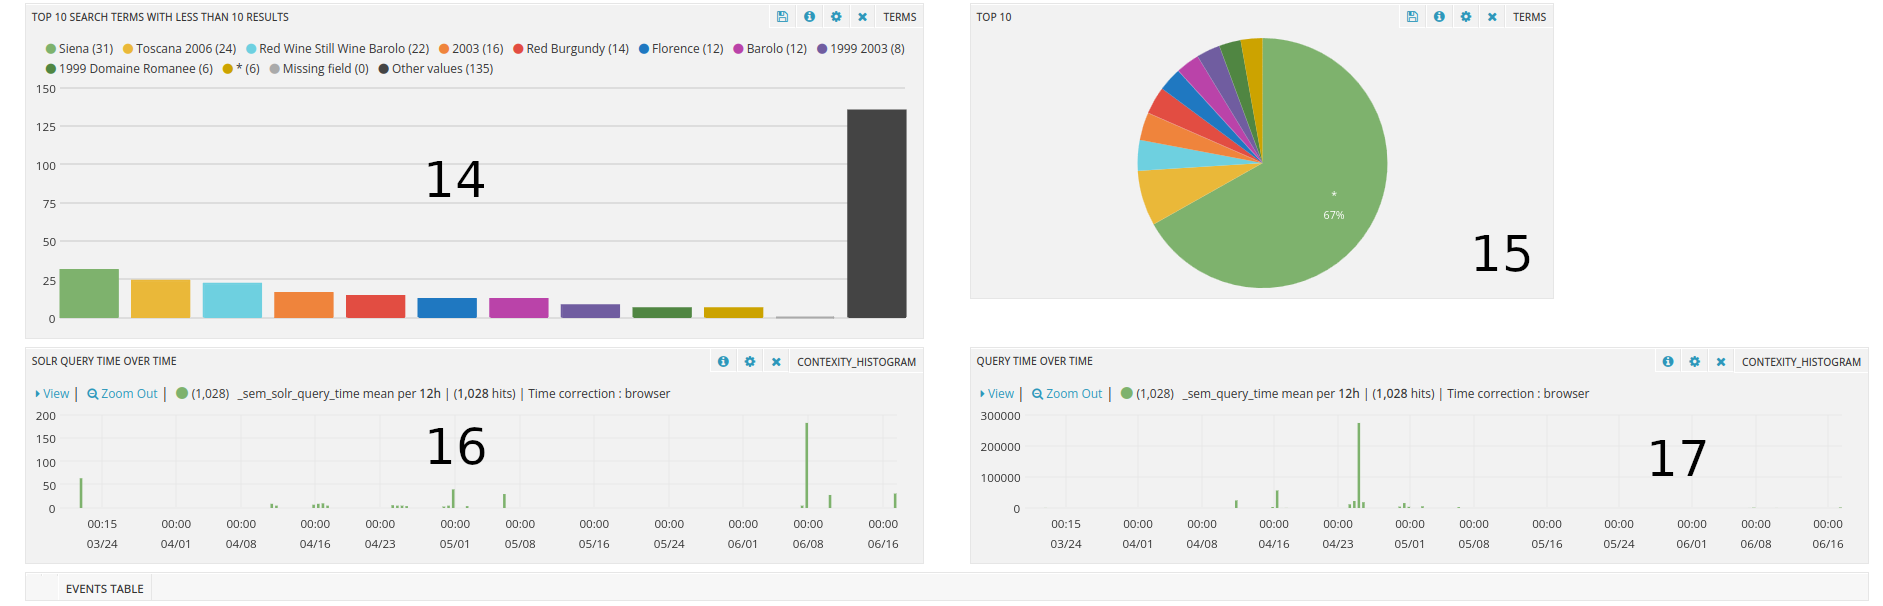
Panel #14 shows the most frequently searched terms that have less than 10 results
-
Panel #15 shows the relative distribution of the most commonly encountered search terms amongst themselves.
-
Panels #16 and #17 show respectively the average request completion time for search requests by Solr and by the Semanteer search layer; note that a Semanteer search layer request always involves at least (and potentially more) Solr requests.
As already mentioned, one can use the search panel to limit the events that are being used to derive the statistics in the rest of the dashboard. The constraints can be expressed as Solr or Lucene filter expressions. To express a constraint, a user needs to be aware of the fields available, which can be seen by opening the “Events table” panel at the bottom of the dashboard (which is collapsed by default). A typical case is to constraint only to events that “real” searches by excluding all requests that have “asterisk” searches, or searches for article / product identifiers, using the expression:
NOT _sem_query_text:("*:*" id\:*)Further to the above, there are a lot of possibilities regarding what panels are shown in the dashboard, and how information is presented in them.